

Author
Amber Baele
Flow Cytometry Scientist Associate
Author
Amber Baele
Flow Cytometry Scientist Associate
Welcome everyone to another Flow Matters blog post! In this blog post, we’ll explore one of the most important topics in flow cytometry: building quality into your flow cytometry data. At first glance, this may seem like a straightforward topic. However, there are many sources of variability that can find their way into your data and ultimately affect the consistency of your results.
To appreciate the importance, we first need to understand that quality is the basis of trusting your data. If the quality of your data is poor, you cannot confidently interpret your results, draw meaningful conclusions, or make informed decisions. Quality is not built through end-point verification alone. It starts with an optimized workflow and the implementation of appropriate monitoring steps throughout the process. This principle applies to every scientific discipline, but as flow cytometrists, let’s take a closer look at what this means in the world of flow cytometry.
Building quality into a flow cytometry assay starts with a well-designed panel. Depending on the instrument type, whether spectral or conventional, and the selected marker-fluorochrome combinations, a panel can be created that reliably detects signals with optimal resolution. We explored these considerations in more detail in a previous blog post.
Once the panel design is finalized, the assay enters the feasibility testing phase. During this stage, the panel is evaluated in a relevant biological matrix using the intended acquisition settings. This allows optimization of instrument settings (voltages or gains), flow rate, and threshold values. After the desired performance has been achieved, these conditions are locked and saved as an assay. This is a critical step, as it ensures that all clinical study samples are acquired under the same predefined conditions, supporting consistency and reducing analytical variability throughout the study.
In flow cytometry, fluorochrome-conjugated antibodies directly influence the measured signal and are therefore considered critical reagents. Although the properties of these reagents should be well-defined initially, maintaining their consistent performance over time is critical for generating reproducible data (Ref 1, 2). The good news is that variability is not something we simply have to accept. It can be monitored, understood, and reduced with the right mindset and quality tools. In the sections that follow, we’ll explore the important considerations that can help us keep an eye on reagent signals and understand how reagent performance can change over time.
The most important quality tool is the mindset of a true scientist. To generate quality data we can trust, we need to be critical and ask questions. The key is to continuously assess whether what we observe makes sense and to troubleshoot anything unexpected before drawing conclusions. For example, imagine that we observe a large CD3+CD19+ population. CD3 is a marker for T cells, and CD19 is a marker for B cells, so seeing a large population expressing both markers is quite unusual. Before concluding that we have identified a new type of cell population, we should be critical and ask questions.
This is where troubleshooting becomes an essential part of data interpretation. Unexpected results are not necessarily wrong results, but they are results that need to be investigated. Only by systematically excluding potential sources of error and by remaining critical about whether the observed signals make biological sense we can have confidence in the data we are seeing.
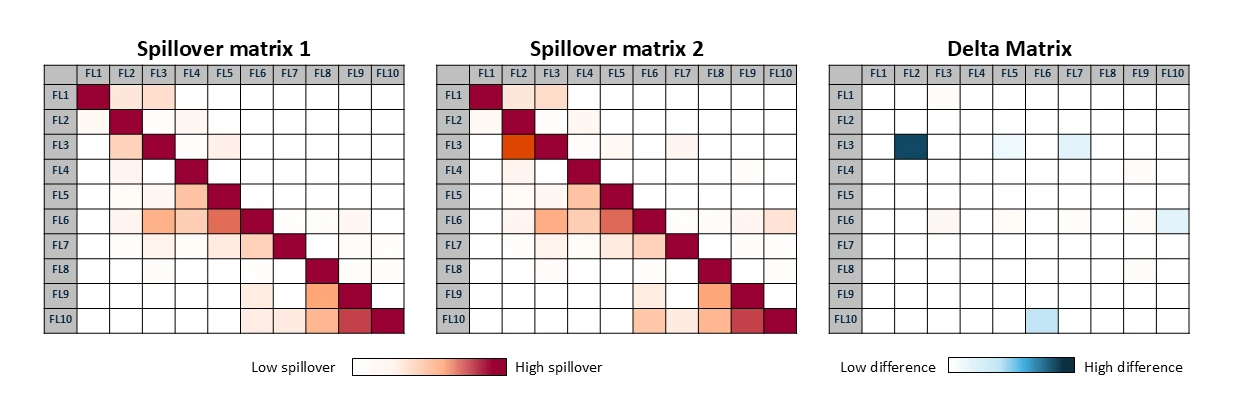
Another important consideration is to regularly monitor antibody spillover. This is an inherent characteristic of fluorochromes. Spillover is corrected through compensation in conventional flow cytometry, while spectral overlap is resolved through spectral unmixing in spectral flow cytometry. However, changes in fluorochrome signal, such as those that may occur when introducing a new antibody lot or by reference controls updates, can affect the compensation matrix or spectral signatures. As a result, a comprehensive evaluation should include evaluation of these spillover values.
For example, for conventional instruments, when reference control updates happen on the instrument. For the BD FACSLyric™ instrument, reference spillover values are maintained within the Lyse Wash default tube settings and are routinely updated by the laboratories. Because changes in spillover values are not always systematically monitored over time, shifts between reference control updates can easily go unnoticed. Understanding and monitoring these changes helps detect potential compensation issues early, ensuring that only reliable settings are applied to clinical data. That is why an extra verification step is recommended to monitor the difference between settings before and after the reference update, looking at the spillover matrices. An assay monitoring tool can be set up (made in Excel, for instance) to automatically compare two assay reports and identify changes.
For spectral flow cytometry instruments, fluorochromes are distinguished based on their unique spectral signatures through a process known as spectral unmixing. Unlike conventional instruments, where compensation matrices may be updated through reference setting adjustments, spectral instruments rely on reference unmixing controls that are periodically updated. For example, the Cytek Aurora™ instrument includes a built-in Reference Controls QC tool that allows users to compare benchmarked fluorochrome spectral signatures before and after a reference control update. By evaluating the updated signatures against the previous references and reviewing the associated similarity scores, users can identify unexpected changes that may indicate issues with control preparation, lot-to-lot changes, or instrument performance. This process helps ensure the quality of the reference controls and supports confidence in the spectral unmixing results.
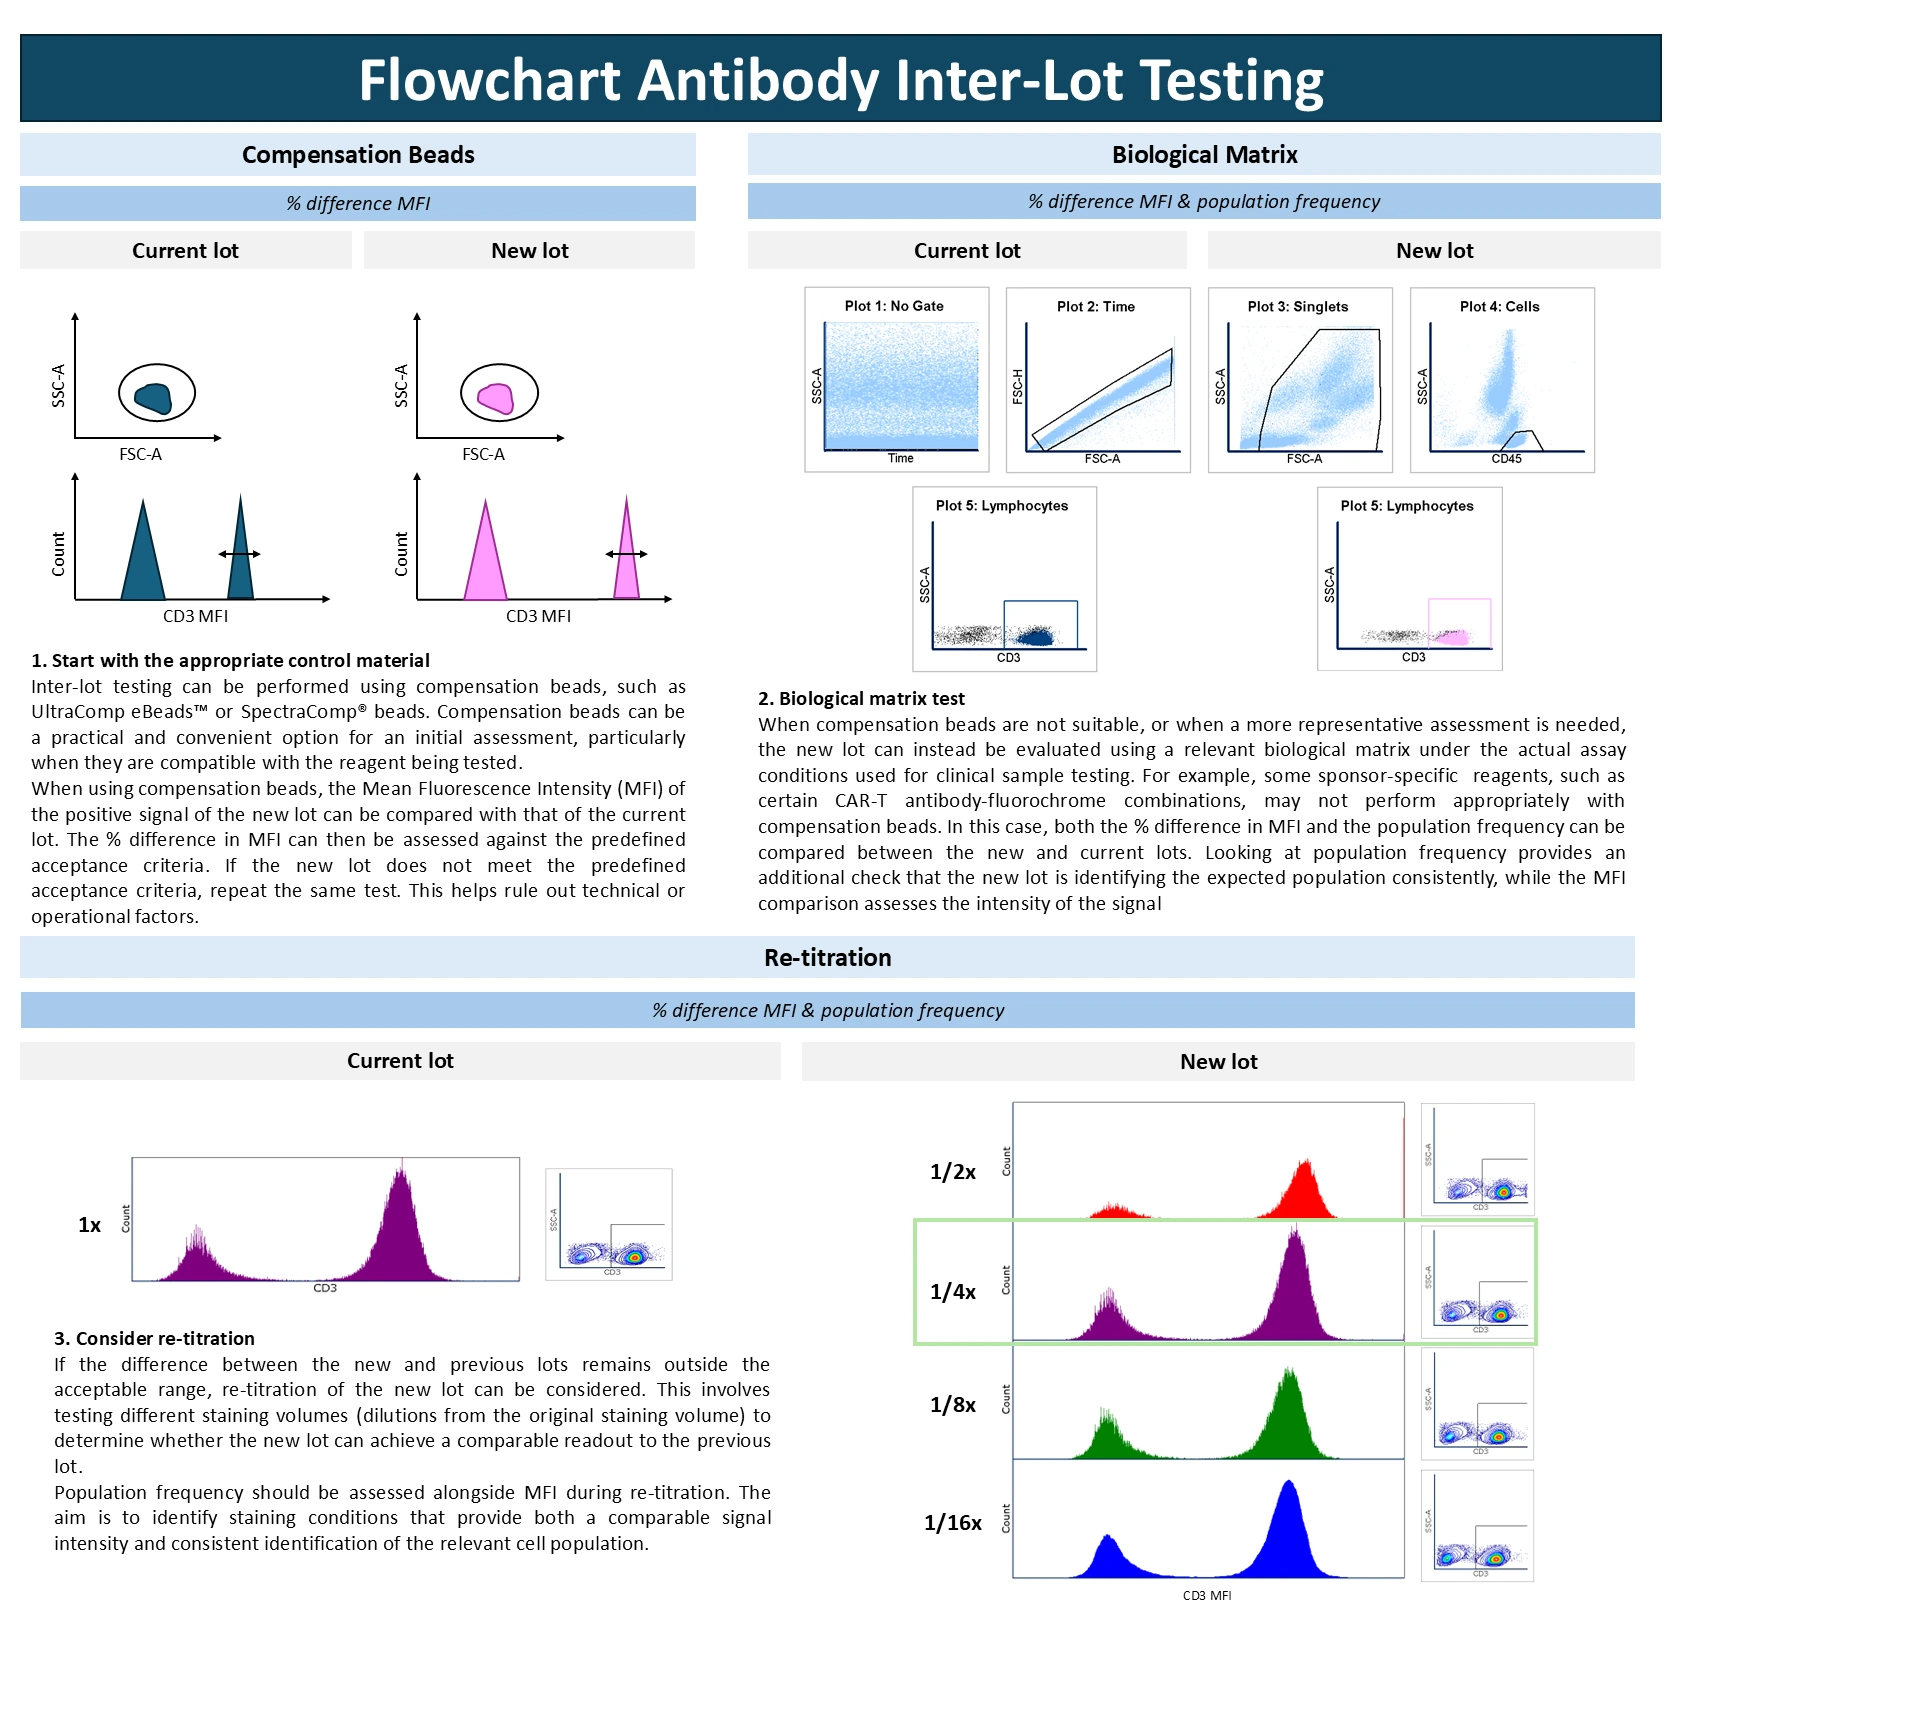
For long-term clinical trials, it is common for the antibody lot to change several times during the course of the study. Each new lot should therefore be re-qualified by comparing it with the current lot in use to ensure that the change does not affect assay performance and that consistency is maintained throughout the study. A good way to re-qualify is by comparing the signal of the positive signal of the new lot with the current lot in use. The next flowchart provides a practical guideline for evaluating a new antibody lot. In the flowchart an inter-lot test for CD3 is illustrated as an example.
Conducting global studies is common practice for large clinical trials and provides important advantages by enabling the inclusion of diverse patient populations across different geographic regions. However, the use of multiple clinical and testing sites unavoidably introduces site-to-site variability. This variability can arise not only from differences in sample collection and handling at individual clinics but also, importantly, from differences in laboratory testing and data analysis.
An important consideration is the separation of local testing from local interpretation. To minimize site-to-site variability for global studies, samples should ideally not be processed and analyzed entirely within the same local laboratory without centralized oversight. For example, data generated from a sample processed at a particular laboratory should be analyzed using a centralized analysis and review framework rather than being interpreted exclusively by the originating site. Establishing a global analysis and review team can help standardize gating strategies, harmonize data interpretation, identify systematic differences between laboratories, and ensure that consistent criteria are applied across the entire study. However, a local workflow can also be reliable for single lab testing if standard operating procedure (SOP) and standardized analysis templates, trained analysts and reviewers, and appropriate central oversight are in place.
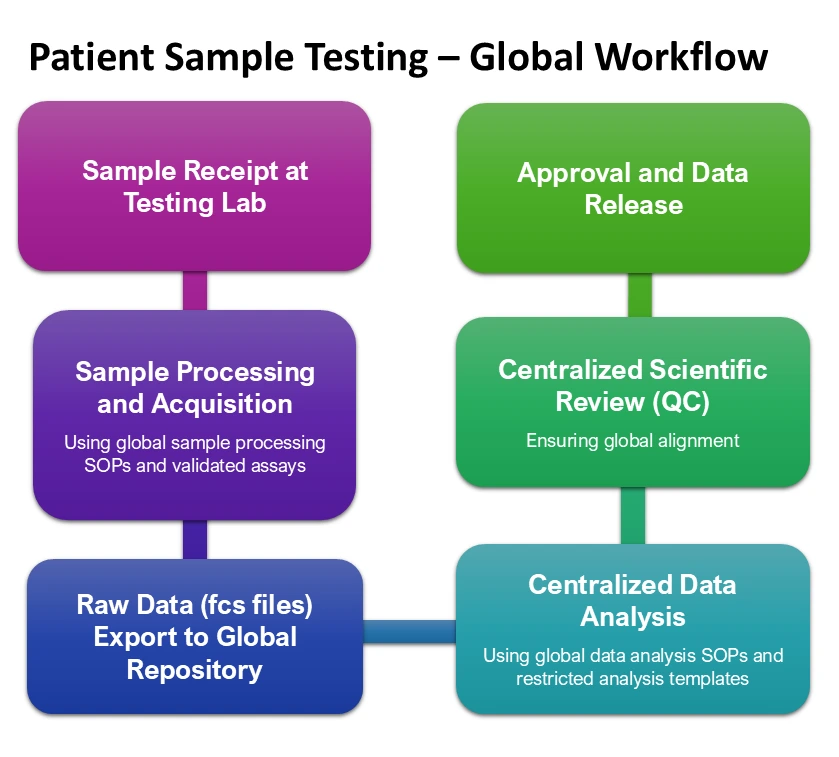
To minimize inter-laboratory variability, clear and comprehensive SOPs should be established for all critical steps of the sample acquisition and testing workflow. These SOPs should be applicable across all participating sites and should define the procedures in sufficient detail to ensure that the same methodology is followed consistently. As described in the first section, the validated assay should be implemented across all testing laboratories using standardized acquisition templates and predefined instrument settings.
Harmonization is not limited to the acquisition of the sample in an instrument. Once data acquisition is complete, the resulting data is analyzed. Although automated gating and analysis strategies have become increasingly important in recent years, human oversight remains essential for assessing data quality and ensuring that the resulting interpretation is biologically meaningful. Data interpretation can be inherently subjective, even among experienced analysts. Therefore, gating strategy procedures should be clearly documented in SOPs. Wherever possible, analysis templates should restrict user modification to predefined parameters, having standardized and quality-checked analysis templates.
Formal training and qualification of analysts and reviewers for each specific assay are mandatory before they begin the routine analysis and review of clinical samples. Equally important is periodic requalification to ensure that competency and consistency are maintained over time. This can be organized through inter-analyst and inter-reviewer comparisons, in which the same samples are independently analyzed and the results compared numerically to identify potential outliers and discrepancies. This is a valuable and practical approach to ensuring that everyone remains aligned in their interpretation of the data.
In addition, continuous communication across the global analysis and review team is essential. Given the inherently subjective aspects of flow cytometry analysis, regular alignment meetings can be organized. These meetings provide opportunities to discuss challenging cases, resolve differences in interpretation, and maintain consistency among analysts and reviewers throughout the duration of the study and periodically.
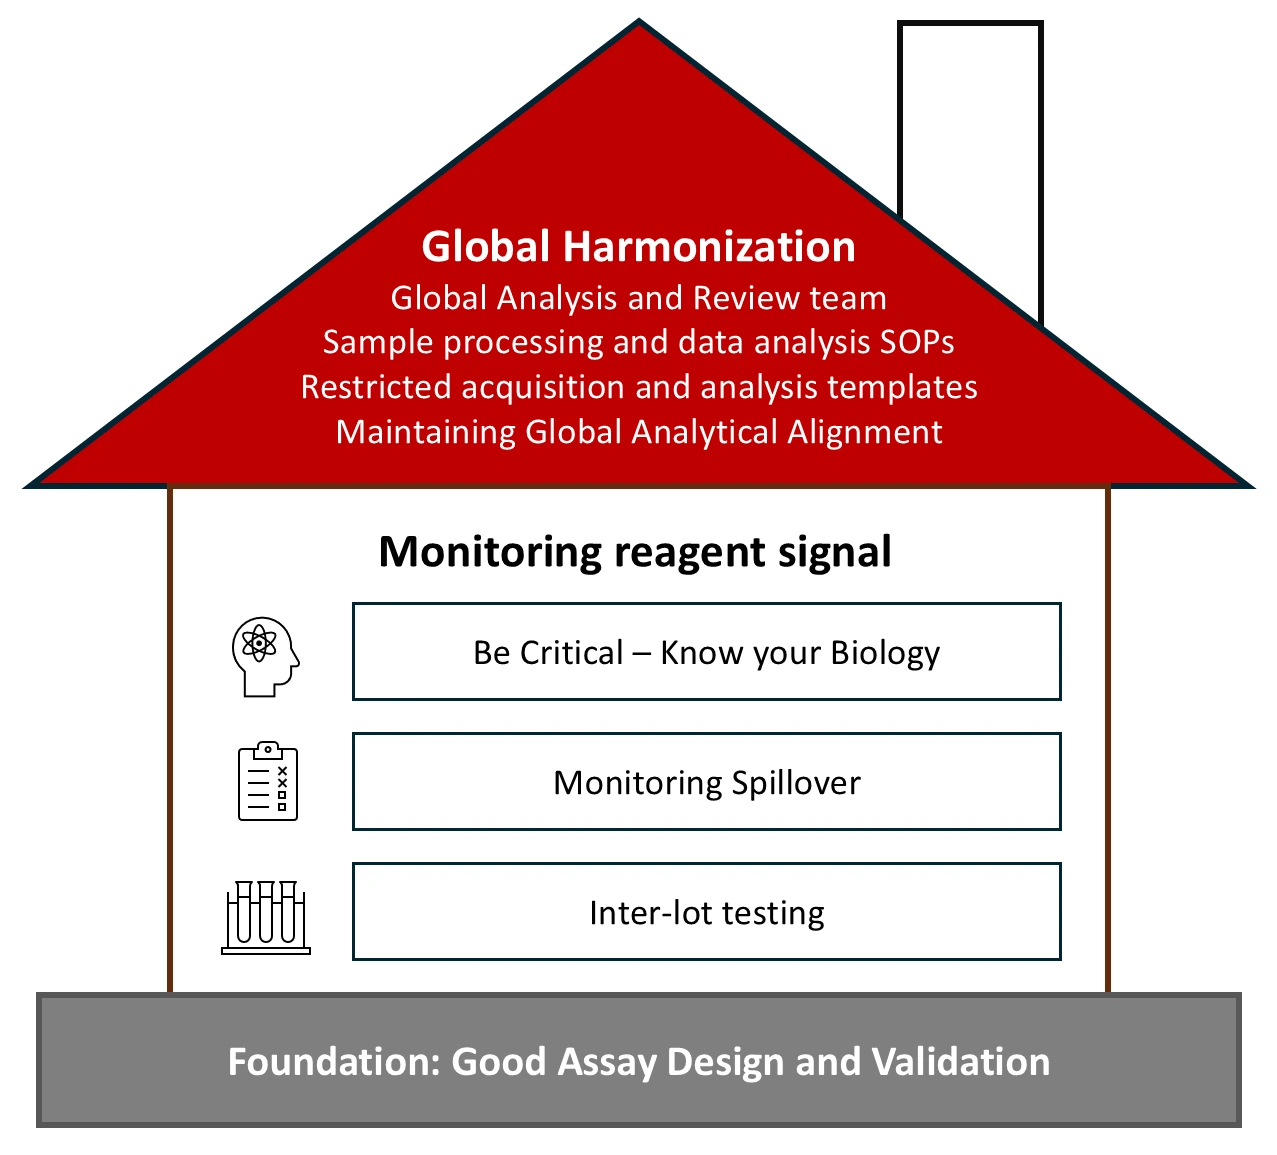
Building quality into a flow cytometry assay is much like building a house. A solid foundation is laid during assay development and reinforced with the validation process. Walls are created through continuous monitoring, and a strong roof is provided by teamwork and global alignment. Together, these components shield the assay from uncontrolled variability, just as a house protects against external weather conditions.
Of course, the goal is not necessarily to eliminate every source of variability, which may be neither realistic nor possible, but rather to detect, understand, and control variability before it affects clinical interpretation. Although we have only touched a few examples in this blog, there are countless considerations that could fill many books. Most important is that quality is not a single activity but a mindset. And ultimately, quality is what transforms measurements into data you can trust.
References
Learn how multiparameter flow cytometry supports AML clinical trials, from patient selection and receptor occupancy to measurable residual disease (MRD) monitoring.
In this interview, NewsMedical talks to Cerba Research’s Coen Stalpers about advances in automation and artificial intelligence in the laboratory setting.

In this interview, NewsMedical talked to Cerba Research’s Lukasz Wulnikowski about the power of automation and how it has drastically changed the way they approach kit-building lines.

Learn more about key oncology trends from AACR 2026 including AI-driven pathology, liquid biopsy advances, antibody therapeutics, and immune profiling in cancer research.